The COVID-19, also called the novel coronavirus, pandemic is affecting all aspects of our lives, globally. It means businesses in our industry are no different so we thought we can help by getting a broader overview of what is still working and what is not when it comes to all facets of online marketing. So we asked our readers at Stacked Marketer, our daily newsletter, to help by filling in a survey. This report is what we found after analysing over 350 answers. A big thank you to everyone who answered or shared this survey!
How We Gathered This Data And What We Analyzed
Before we go into any of the findings, we do want to explain how we gathered the answers. We ran an anonymous multiple choice survey asking the following mandatory questions:
- Where do you buy most for your traffic?
- Is your product physical or digital?
- In what category does your product or products fit best?
- Where do you sell your product? (country or region)
- How much did you spend per day before the outbreak?
- How did your average daily spend change in March so far?
- How has your overall CPC/CPM changed?
- How has your overall CVR changed?
- How has your overall ROAS changed?
- How has the outbreak impacted your business?
We also allowed 2 optional comments. One to explain the product or service and another to give any comment on bigger trends they have seen. Some of those answers will be featured later.
Some obvious limitations of this report: With 350 answers, we will only be able to give a reasonably complete answer for a handful questions. We won’t be able to give granular input and exactly quantify impact.
For example, there was no significant difference between countries or regions so we were not able to create a section to measure the different trends between USA, Europe and others.
Use this as a guideline, not as definitive data to make vital decisions.
Comparing The Impact On Physical To Digital Products
We’re going to first look into a comparison where most marketers have the correct intuition: Physical vs Digital.
What most would expect: With people stuck at home, digital products should be in higher demand. Let’s see what our survey says…
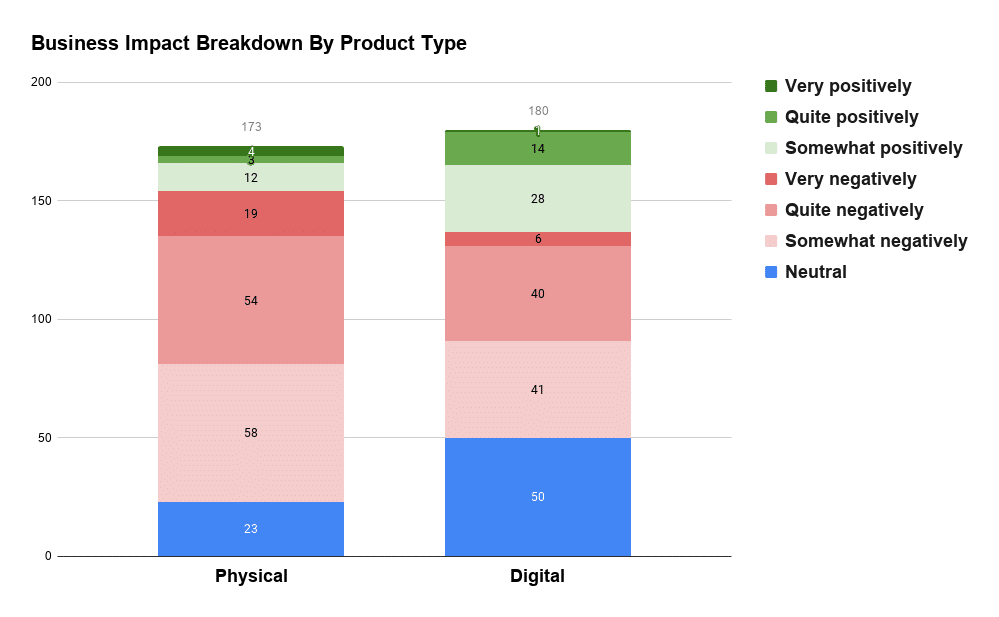
When it comes to a positive effect, some physical products did see a positive result too but digital products clearly dominate those that answered they have been impacted “quite positively – the product or service is in higher demand” or “very positively – everyone now needs what I’m promoting”. Let’s look at the other side and check the share of businesses that were affected negatively.
As expected, the ratio is very different so there’s been limited positive impact for some physical products (we will look into the categories later) but digital products have seen more of a positive impact than physical. Very importantly, 6 of 180 digital businesses said they are very negatively affected – unlikely to survive, while a whole 19 out of 173 said the same for physical products.
We can also look at the ROAS, CVR and then the change in ad spend for each, side by side. Left side is for physical products, right side is for digital products.
Return on ad spend comparison:
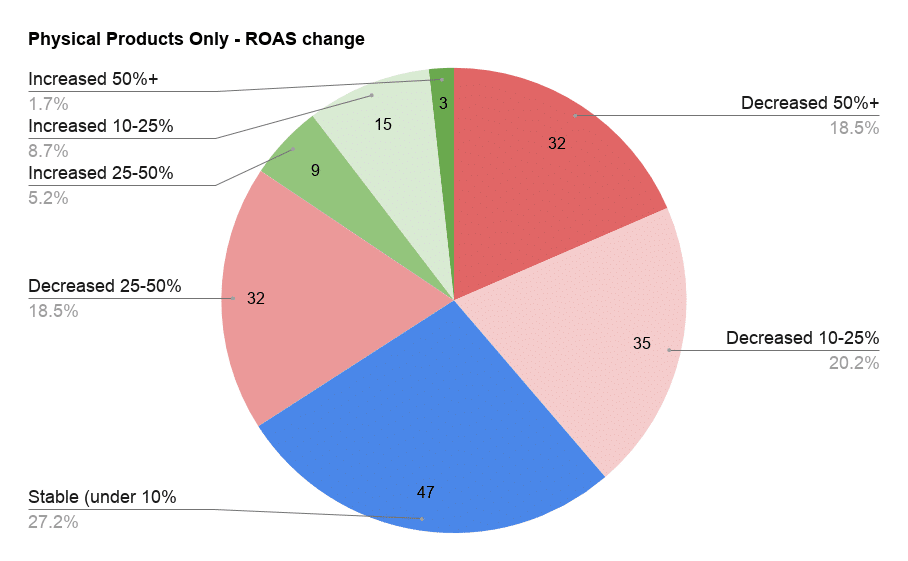
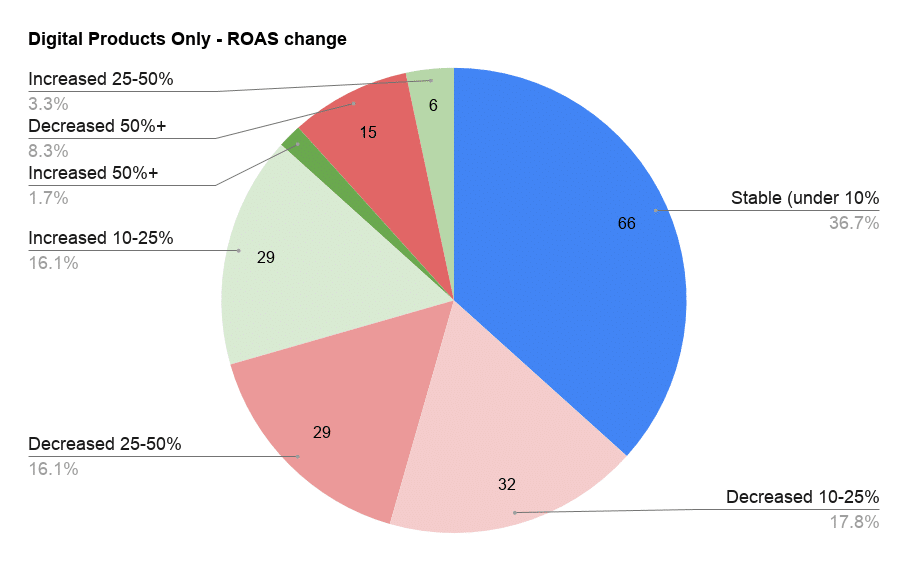
More stability for digital products (2nd image) and a larger segment with a 10 to 25% increase in ROAS.
Conversion rate comparison:
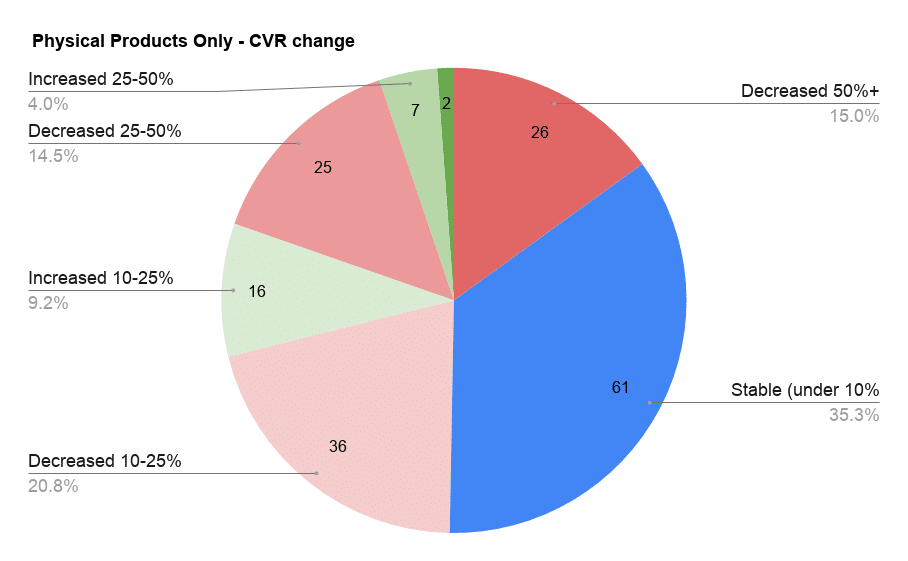
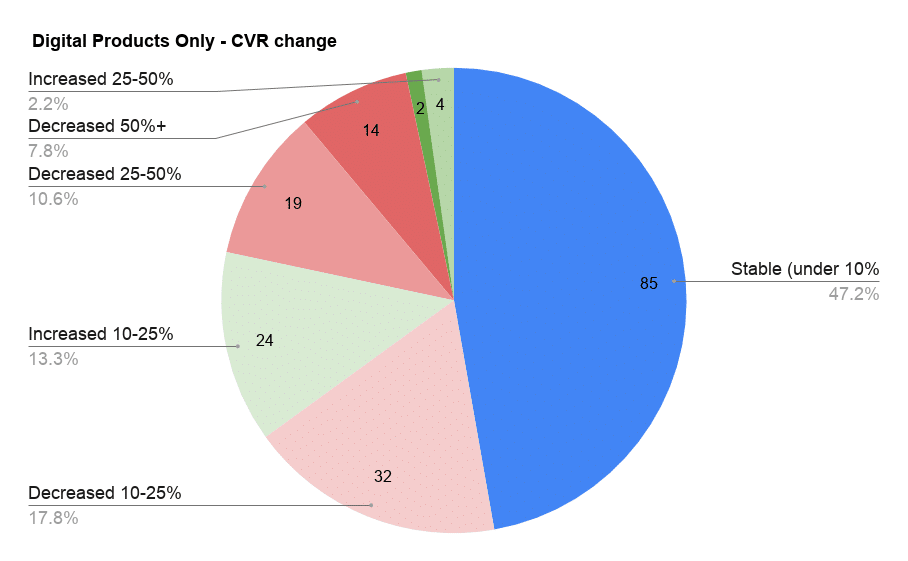
A similar story here too… almost half of the marketers promoting digital products (2nd image) saw little change in CVR. The segment seeing a nice increase is also larger than for physical products.
Ad spend change after the outbreak:
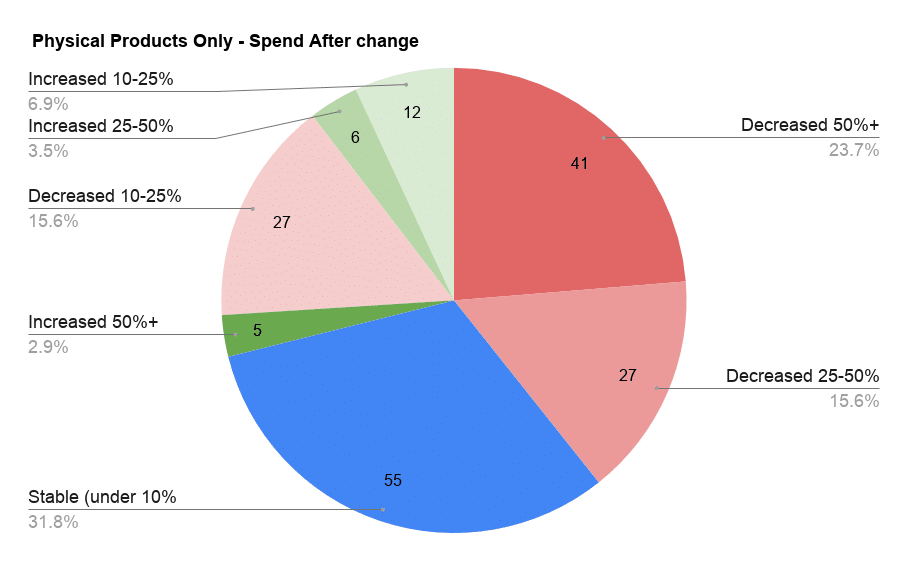
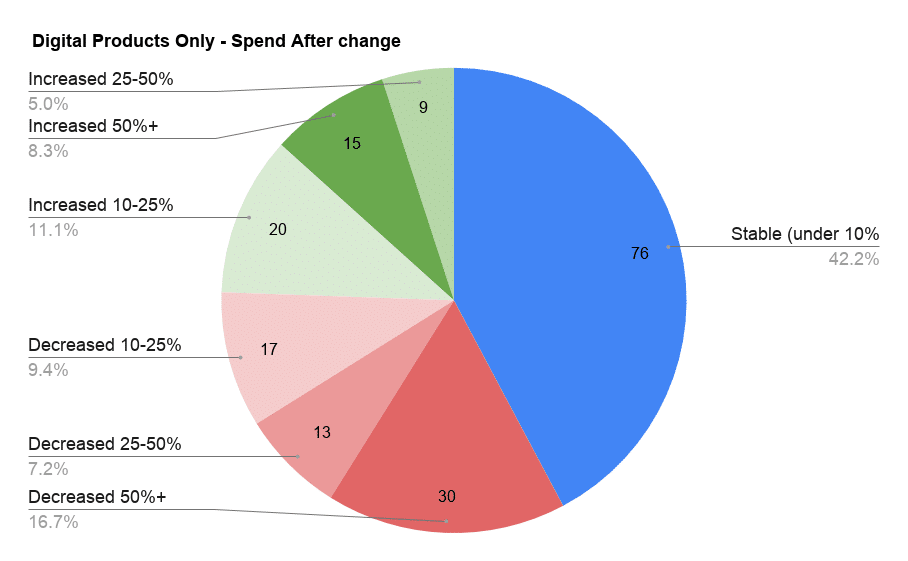
When putting everything together and looking at ad spend change too, we could assume something interesting: It could be that physical products have significantly decreased their ad spend to even keep a reasonable ROAS and CVR. In other words, they have scaled down and focused on the best performing audience. So their ad spend has decreased more significantly to even sustain a slightly lower ROAS and CVR. In comparison, digital products see a more even split of increase vs decrease and again, almost half saying ad spend was stable.
Physical vs digital: If there was any doubt, our survey pretty clearly shows that, on average, digital products are seeing more stability and even more improvements in their ROAS, while physical products are mostly seeing a decrease in performance.
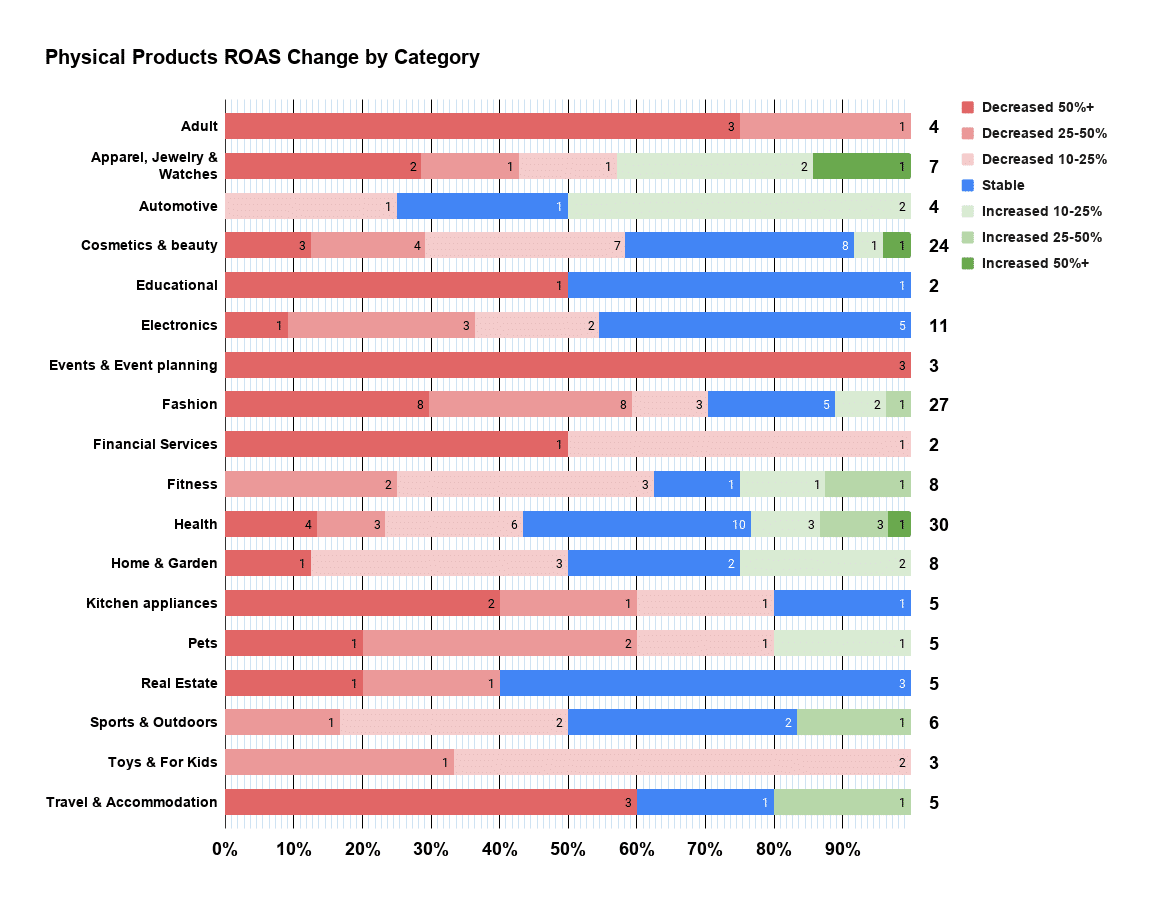
OK, there’s one more thing in this section of our report. Would you like to know which physical products categories actually saw some increased ROAS? Here’s the breakdown of the most common categories. The more green, the better.
Facebook Ads Vs Google Ads: Which One Is More Stable?
These two are the main ad platforms worldwide and it was no different for our audience. Unfortunately, with the number of survey answers we could only realistically look at how stable advertising costs were in this period. There’s also the caveat that Facebook Ads uses a CPM-only model. Here’s how traffic costs changed on Facebook (first image, the one on the left) and Google (second image, the one on the right).
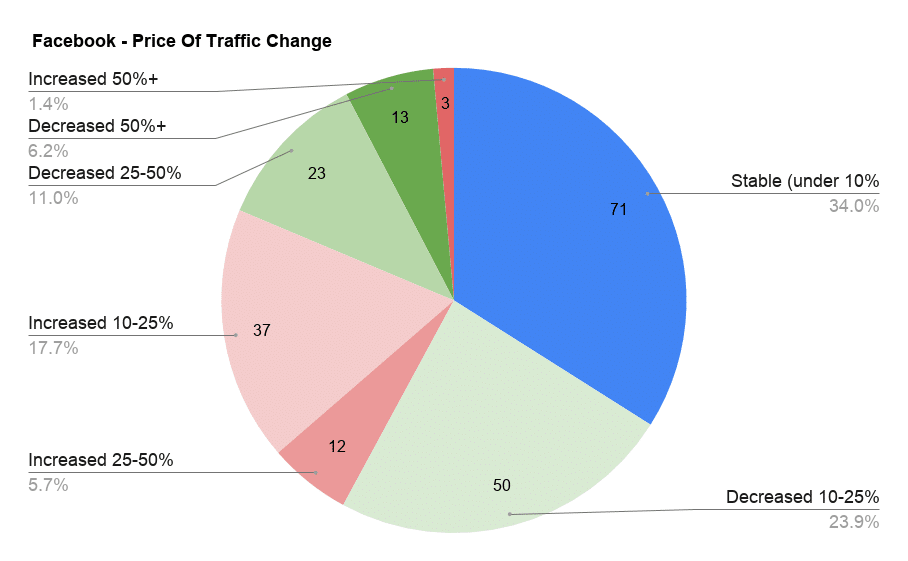
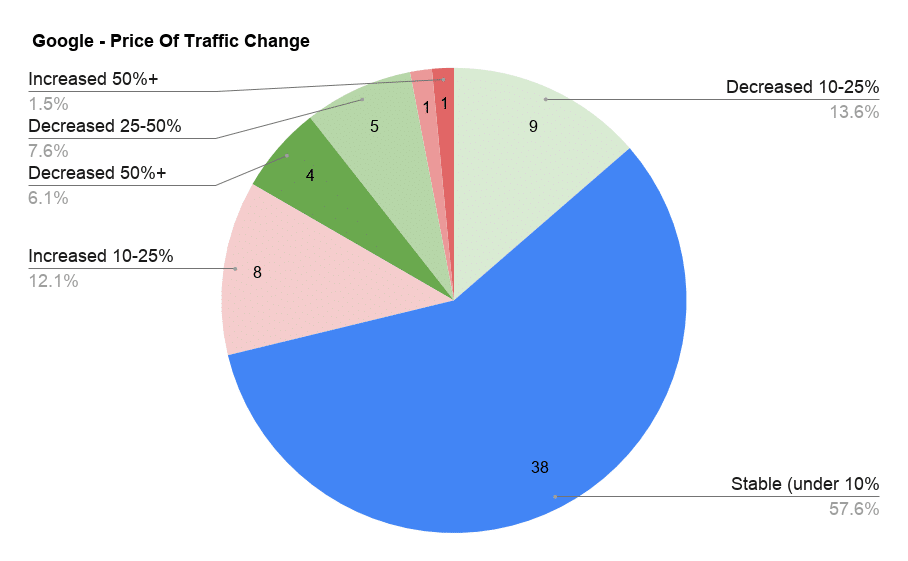
Two very different stories… Google Ads has shown to be quite stable. On the other hand, Facebook Ads has been less stable, there’s more variation but usually there’s a decrease in price.
One thing to mention is that we do not have a comparison to the results of a survey done at a random time. Especially for Google Ads, we would not be too surprised if the results are the same at most points in a year. In other words, Google Ads is likely more stable than Facebook Ads on average, which is why FB sees a higher variation in this period too.
Comparing Performance Of Product Categories
It starts getting juicy here because we will dig into exactly what categories do well, which don’t and some other interesting points about categories or products. What we hope to show here is to point marketers into a direction that is more likely to get them good results.
Let’s start off by showing a general overview of all answers so you can see how many businesses are affected positively and how many negatively.
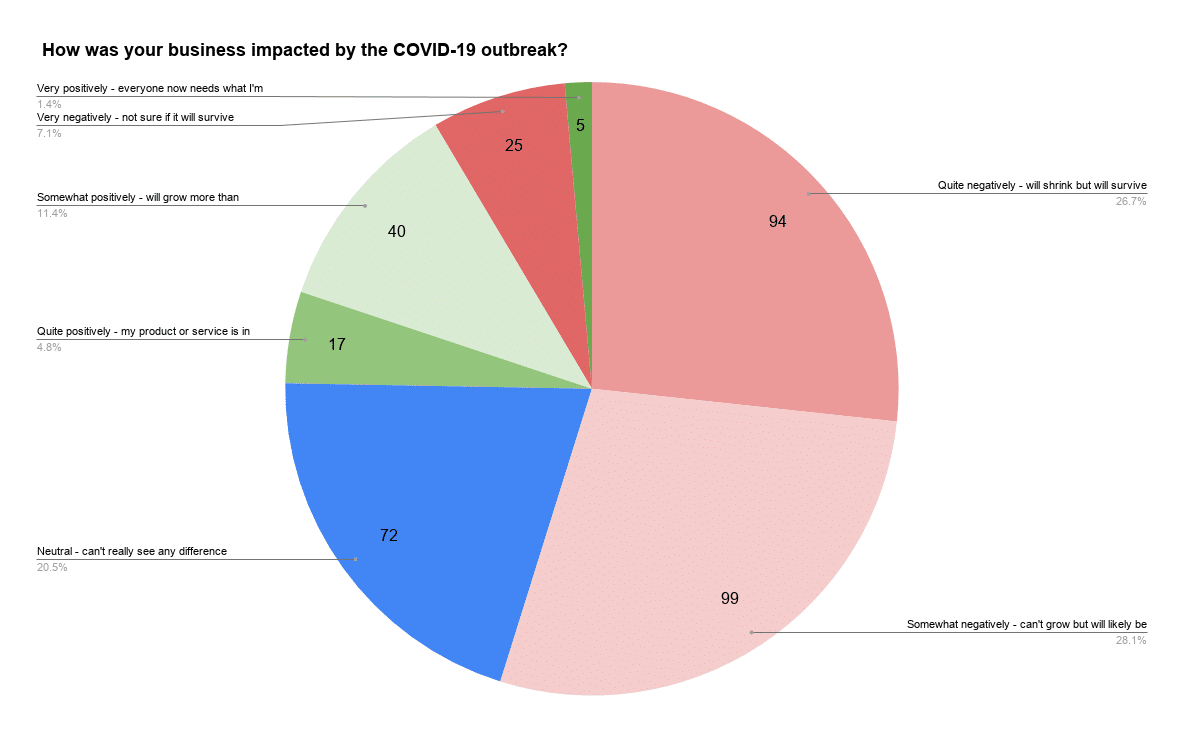
As you can see, most businesses were affected negatively so when we try to find the categories positively affected there will be fewer answers. Take it with a grain of salt…
We also cannot say for certain how many of these businesses were negatively affected just because marketers’ and founders’ analysis paralysis, overthinking or outright panic. We understand this was a disruption in many aspects but we cannot account for the psychological disruption this had on individual marketers.
Now, let’s look at a pretty big breakdown by category of some of the most popular product categories.
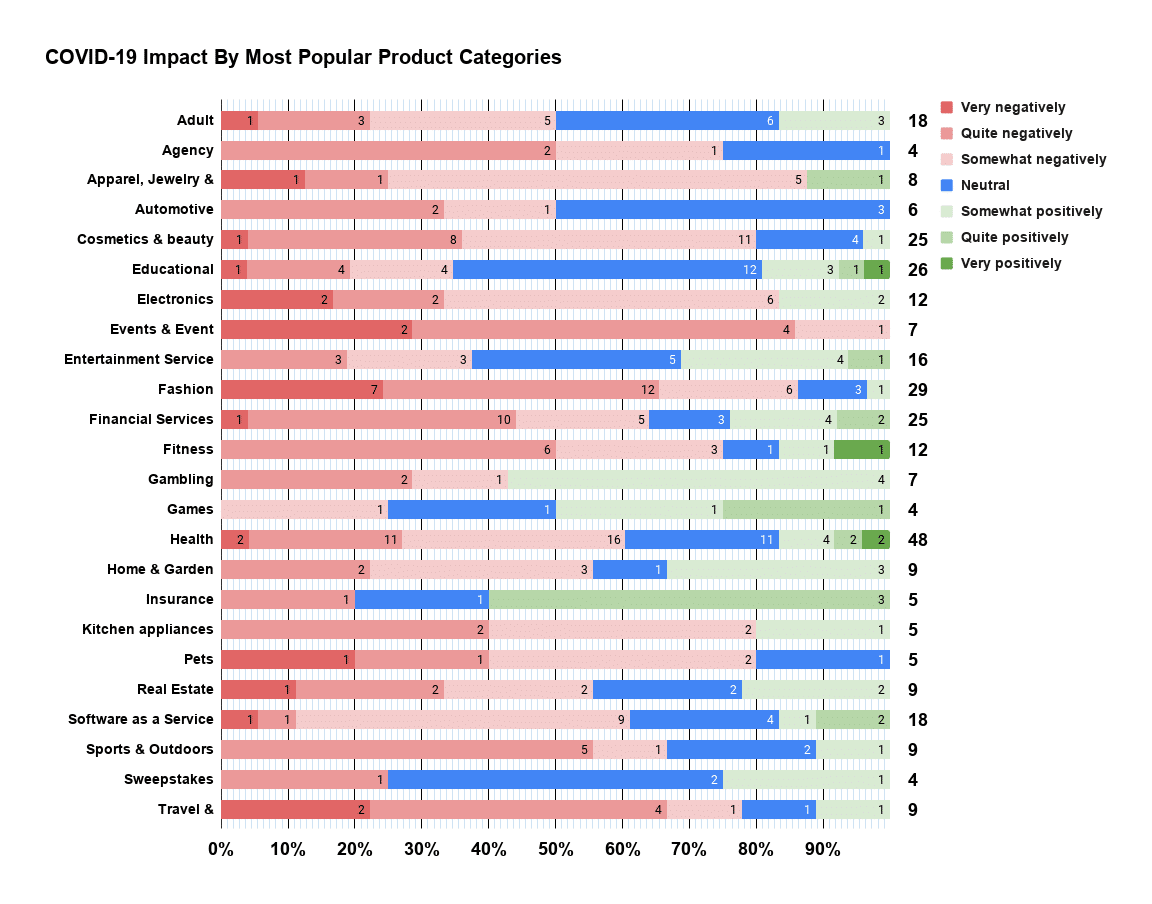
What can we still say is pretty reliable? Well, there are some categories that show fewer shades of red.
- Educational
- Entertainment Services
- Gambling
- Insurance
- Sweepstakes
- Adult, maybe?
Now, keep in mind that they have different sample sizes, so some of them are less reliable than others.
We’d also like to highlight the health category. It’s pretty balanced and with a lot of answers so there must be something still in demand there… Plus, we have this nice quote from a reader.
Some supplements like Vitamin C and immune boosting supplements like Cold Front and Monolaurin are sold out or back ordered in many places.A helpful Stacked Marketer reader
So that’s at least some information about what type of health products are in demand…
There’s also an exception that we do want to mention. Prepper/Survival products, although we had only ONE answer, it was very positive so it’s worth trying to explore the category, if you get the opportunity.
We believe this quote sums it up pretty well. It comes from a Ilya, who has access to information across an affiliate network with a wider range of verticals.
Sports betting has decreased due to the main sports events 2020 cancellation. eSports is expected to become more popular for bettors and replace outdoor sports events for some time.
Ilya Kononovich from Zorka.Network
Lottery and casino (social/real casino) have increased their daily average users. Coronavirus outbreak has impacted the economy of many countries. In Russian region additional shake is devaluation of local currency (RUB) on the worldwide arena. People are bewildered what is gonna be next. As a natural outcome it is easy to trigger users to test their luck and win big money.
Local delivery is in high demand. The more people are isolated the more delivery is on the rise.
Educational content is in high demand as well. People finally got their ideal time for making the progress in the desired field.
What Kind Of Businesses Said They Will Struggle
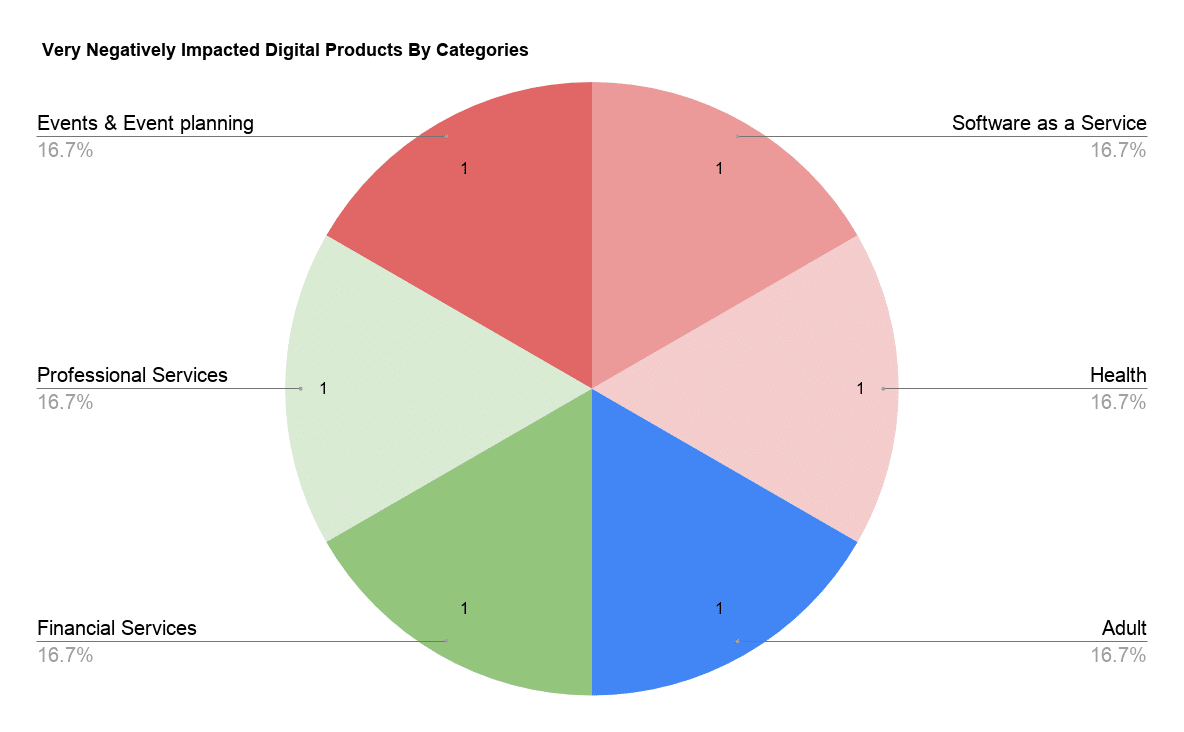
We briefly touched on categories already but we also wanted to look into business types one more level deeper. This means, we want to look at physical or digital businesses that said they will struggle based on category. We’re especially looking at the businesses that said they are very negatively impacted in this section, those that might be in danger to not even make it through alive. First image is looking at physical products that said are unlikely to survive, the second at digital products with the same answer.
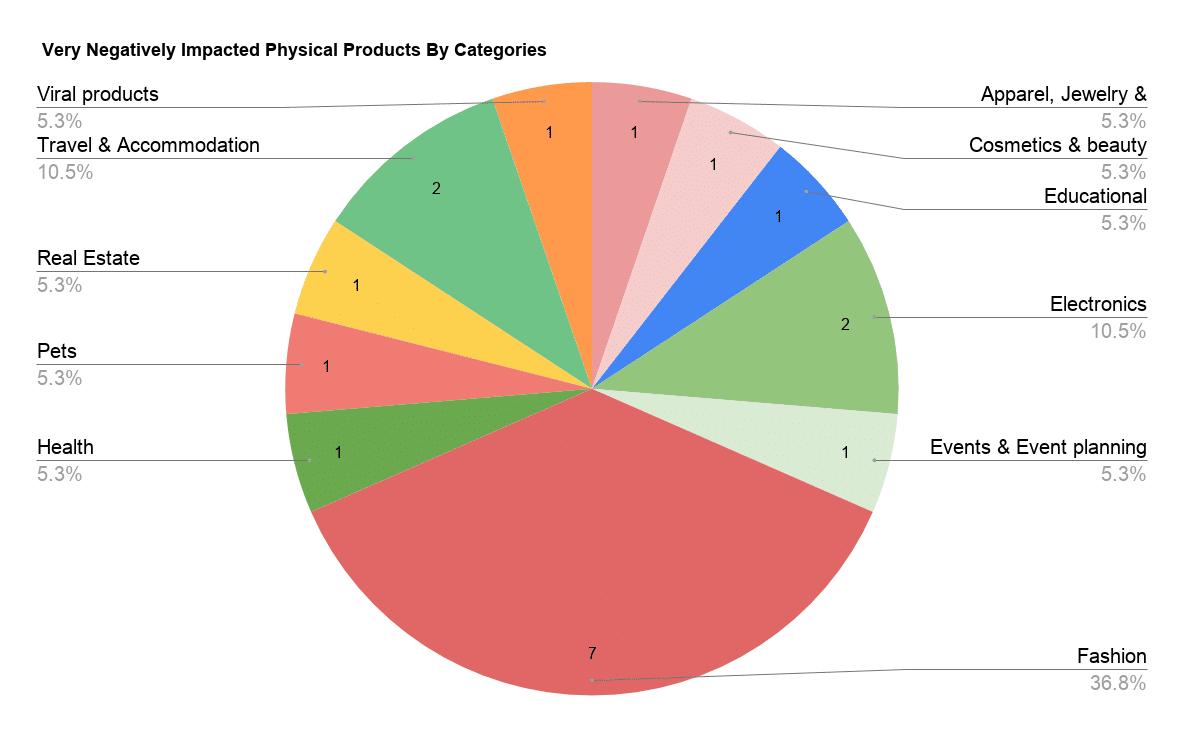
With the information from before and what we see here, we can say that’s it’s probably a bad time to be promoting fashion related items.
Why could this be? Consumers are mostly stuck inside and they have their minds on something else than fashion. Aside from the consumers though, fulfilment is focused on essentials so there might be issues with that side of the business too. Companies that can produce clothes, for example, might be switched to producing some basic medical masks and gowns. The combination of these factors might make fashion products one of the most hurt.
What Businesses Are Thriving
Some businesses must be doing really well, right? Well, not exactly. While some businesses were positively affected, only 5 our of 353 answers said they were “very positively affected, everyone now needs what they are promoting”.
Out of those 4 were physical products in the following categories:
- Fitness
- 2 x Health
- Food & Drink
The one in digital products is in the “Education” category.
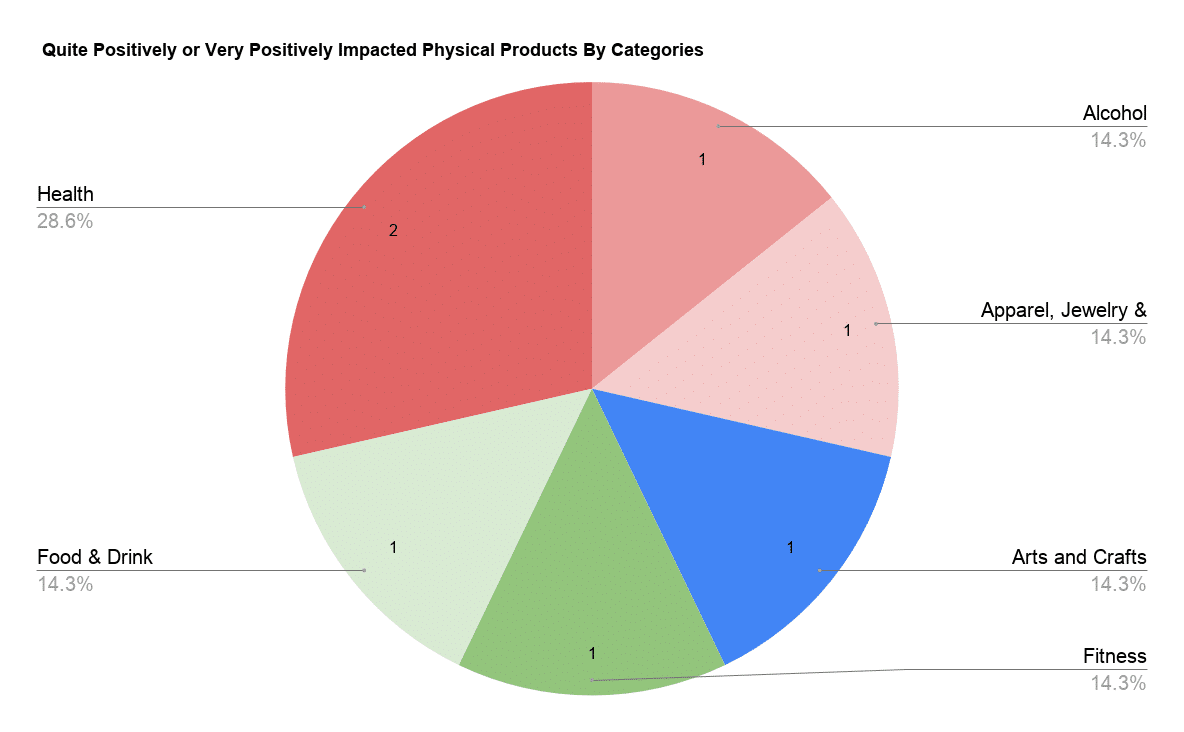
Since there’s not more data on this, we did want to look deeper at businesses that still saw a very positive trend, even if not as strong. We will look at physical products and digital products separately… The first image, on the left, is physical products and the second, on the right, is digital. You might be seeing a trend by now…
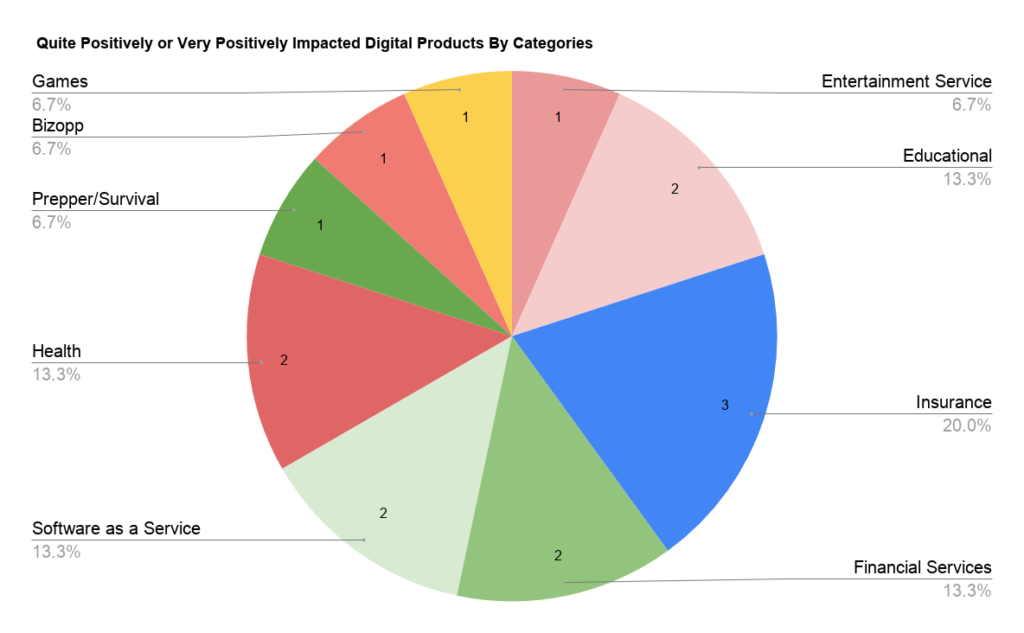
You might notice that “Insurance” category there, right? Here’s a quote from one of the answers…
Funeral insurances. Start ramping up your SEO now!
Another Stacked Marketer reader
While we are on the slightly more optimistic side of things, it’s probably true that people realised life is fragile and are preparing for the inevitable more than usual. Whether that’s a correct reaction or an over-reaction, we cannot say…
Aside from that, you already know that digital products are doing better than physical ones.
Conclusion And Our Comments
As we said at the very beginning, this is far from a complete overview but it does identify a few trends that we’d like to mention here. Some of these might have been easy to predict but it’s always nice when there’s a survey to help make that prediction more accurate, right?
- Most businesses have been negatively impacted but there are some outliers.
- Businesses that rely on promoting physical products have been hit much harder and are the ones in more danger to go out of business than digital ones.
- Even through this period, Google Ads seems much more stable than Facebook Ads.
- Sports betting affiliates are out of luck with all competitions being postponed or cancelled.
- Other negative outliers are fashion, travel & accommodation and pets. Fashion actually with a reasonable sample size too, relative to the rest.
There’s also a silver lining, some businesses that can do well or are doing better.
- Health related, especially if there are no fulfilment issues.
- Prep/survival type products.
- Gaming.
- Gambling and casino not sports betting.
- Insurance.
- Financial services.
- Educational digital products.
- Digital entertainment.
- Plus, some reliable sources told us adult cam websites are seeing a strong uptick.
If you already read Stacked Marketer, maybe you are wondering how it impacted our newsletter business, right?
Well, we’re a fully remote team so our day to day was basically unaffected.
Our open rates were stable at 45% because people are still looking to consume relevant content. When it comes to revenue and sponsors, we had 2 weeks where many asked to delay our partnership until they settle into the new workflow of working from home and figure out other changes on their side. This did affect our March revenue but we are already seeing positive signals for April.
That being said, it’s the first time we crowdsourced such information and we hope it’s been useful. If you see anything that needs fixing, just hit us up and we’ll be on it right away.