The unpredictable economy is hitting industries right, left, and center.
E-commerce is no different. If you’re in the business, you might’ve noticed some of the punches—ad costs going up, fulfilment and logistics fees skyrocketing, customers growing more cautious.
But there are also some factors that tell a different story.
Just four months ago, Shopify announced another record-breaking BFCM period. On top of that, Q4 2023 was reportedly the most lucrative quarter for e-commerce retail sales.
All this could indicate that the e-commerce industry might bear a huge recession-proof shield. Or does it?
Well, it’s time to look at some charts.
🖱️📈 Clicking on each individual chart will take you to its interactive board.
The growth of e-commerce up to 2024
Since the early 2010s, the e-commerce industry has seen relatively steady, linear growth.
But then Covid hit. And the rest is history—albeit a recent one.
To illustrate how big of an impact lockdowns had on the rise of e-commerce, check out the trending dark blue line:
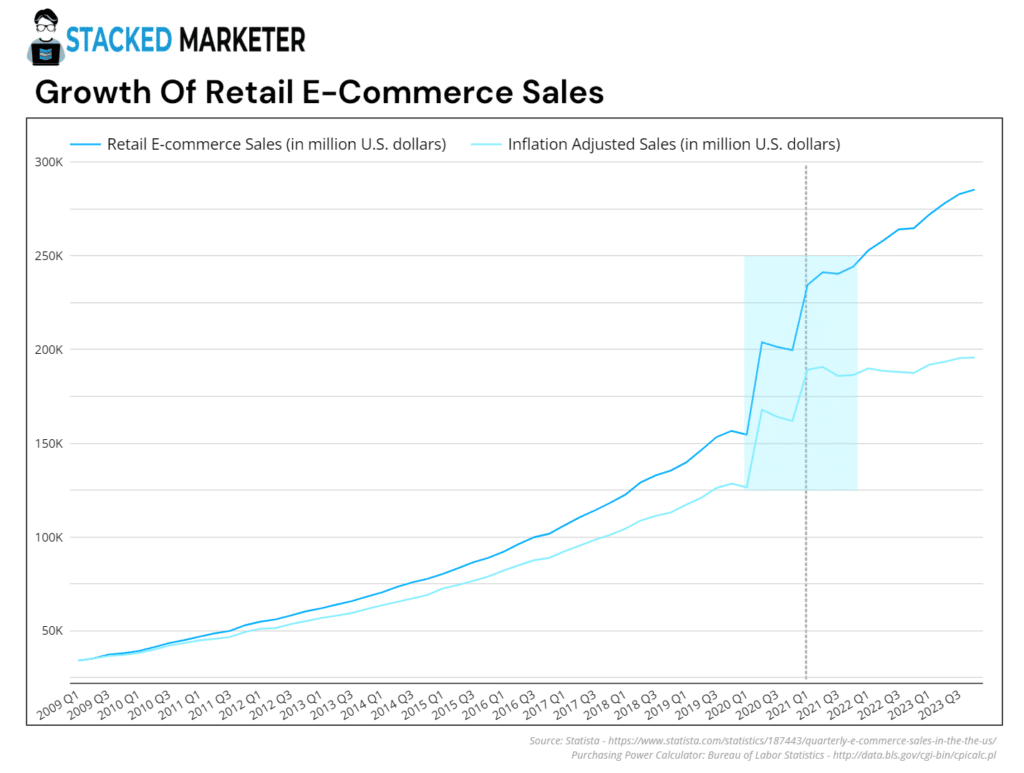
Look at that steep jump. And this is for the US only.
For more perspective: The growth between Q1 and Q2 in 2020 (32%) is higher than the growth across two entire years before that (28%).
Moreover, the one-year jump from the start of 2020 to the start of 2021 indicated a 50% YoY growth. That’s huge. The growth curve went up consistently by the end of last year. So it’s growing…
Or does it? Take a look at the light blue line that shows inflation adjusted sales. Notice how the lines start parting ways sometime around the beginning of 2021?
What does it mean? That the actual money spend in Q4 2023 wasn’t that far off the money spent in Q4 2021 when adjusted for inflation.
There’s possibly no actual, record-breaking growth in e-commerce. The value of goods and services – when adjusted for inflation – are almost flatlining from it’s peak in 2021.
The verdict: E-Commerce isn’t really growing as rapidly as suggested. In fact, it could be entering a stage of slowing—or we can say—consolidating.
📉 You can’t trick us, inflation: What we did is we used the official CPI inflation calculator to showcase inflation-adjusted numbers starting from Q1 2009.
By looking at the chart, you can notice that the sales actually stagnated despite the revenue numbers telling a different story.
How many online stores are there in the world?
Sorry to disappoint you, but there’s no official number.
However, if you pull data from various sources online, you can assume there are over 26M e-commerce stores in the world. Not all are active, of course.
But are they growing… or slowing? To get a better understanding of the rise of e-commerce, we looked at Store Leads store-tracking data:
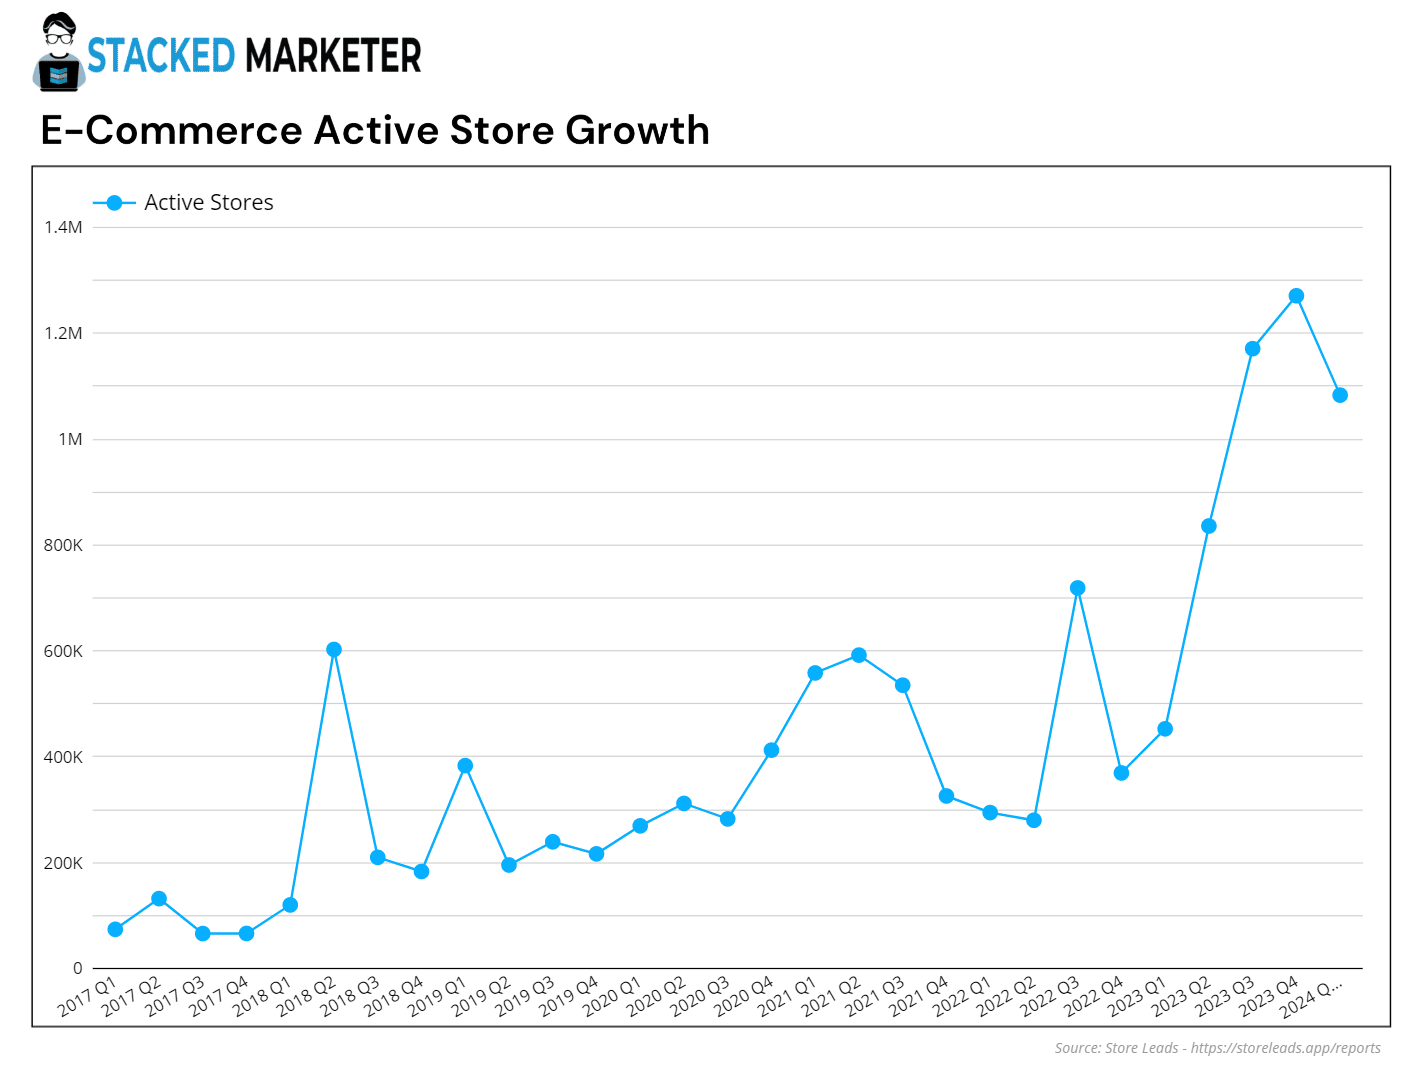
*Click the graph to access the cumulative growth chart.
Store Leads only counts active stores across a number of most prominent e-commerce platforms by tracking their historical data. So custom-coded online stores, or stores that exist only on big marketplaces like Amazon or Walmart aren’t counted.
What do we notice: The graph corresponds to the trend of e-commerce revenue growth.
At the start of the Covid pandemic, there were around 4M stores. Two years later, that number was already 7M. Year and a half later, we’re at around 12M active stores.
What’s wild, the previous 3 quarters saw 1M+ new active online stores across all platforms.
So it’s safe to say that more and more merchants are pivoting online.
🥧 Smaller slices? Despite the amassing stores, data shows that the shoppers are growing cautious. So we can assume that 1M+ new stores that launch every quarter might have a tougher time biting a large piece of the e-commerce market pie.
Are we entering the e-commerce depression?
Let’s find out by focusing on the most important cog—the consumer.
Reports indicate that 2024 will continue a trend of more frugal spending—which can reflect negatively on your revenue as well as your ad performance.
But new data shows that tides might change:
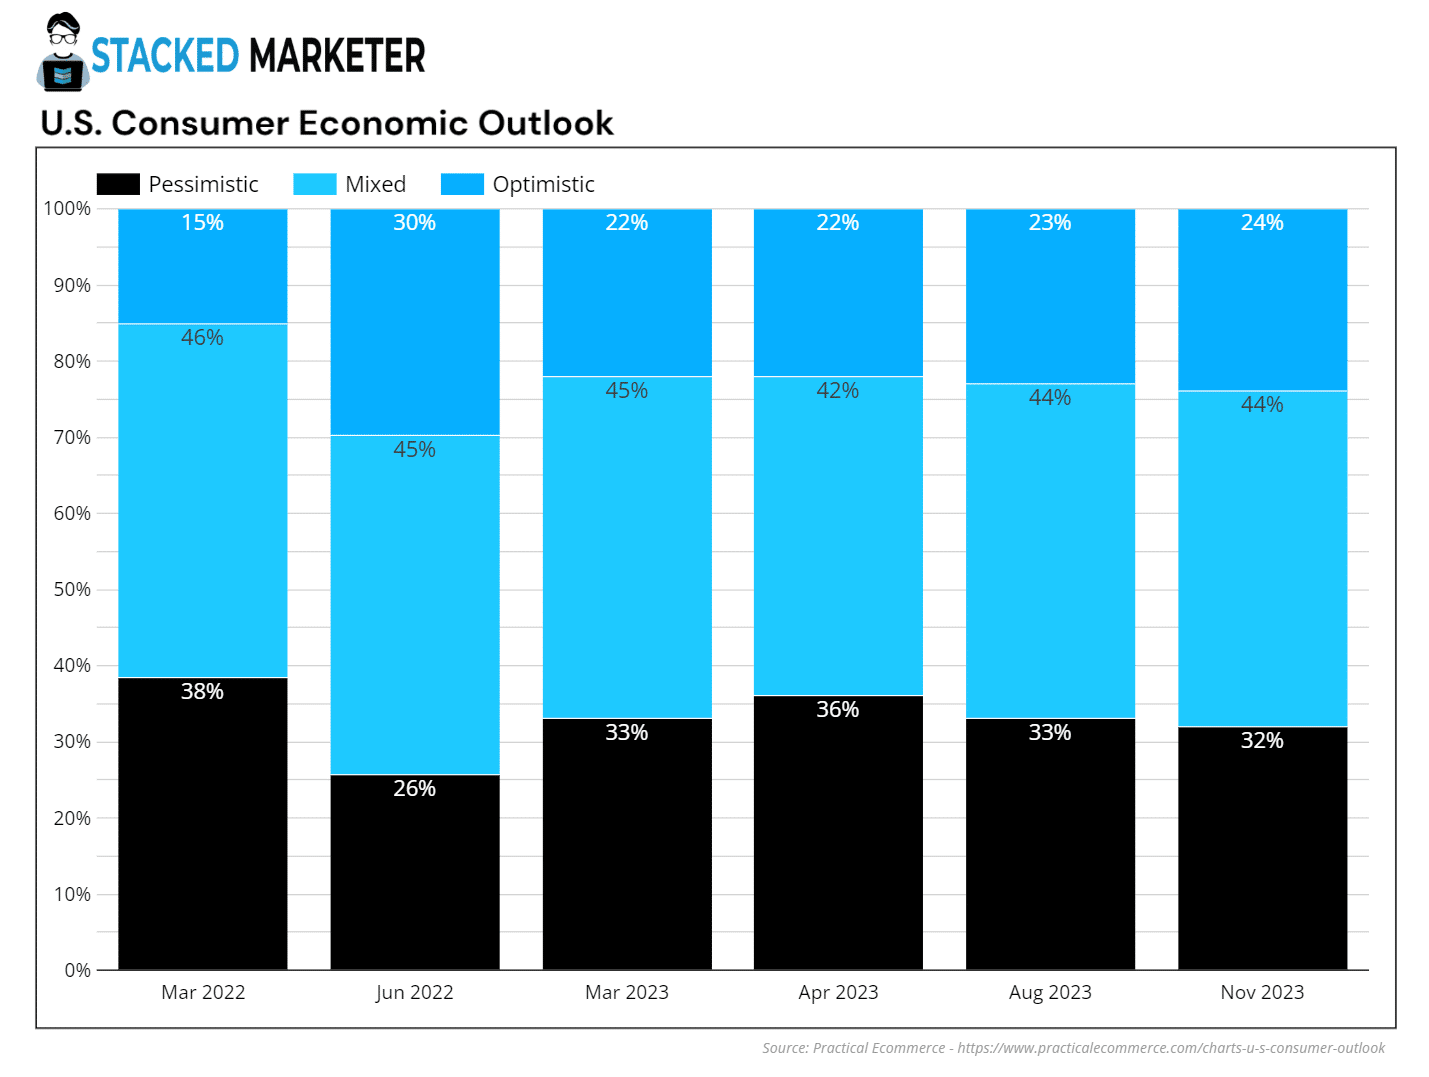
In March 2022, there was much more economic pessimism among shoppers.
In March 2023, customers had a brighter outlook, with pessimism being at its lowest since June 2022, and decreasing steadily over the year.
If the trend continues in 2024, there might be more shopping activity this year, especially during Q3 and Q4—the period when shopping heats up.
But it’s too early to conclude anything:
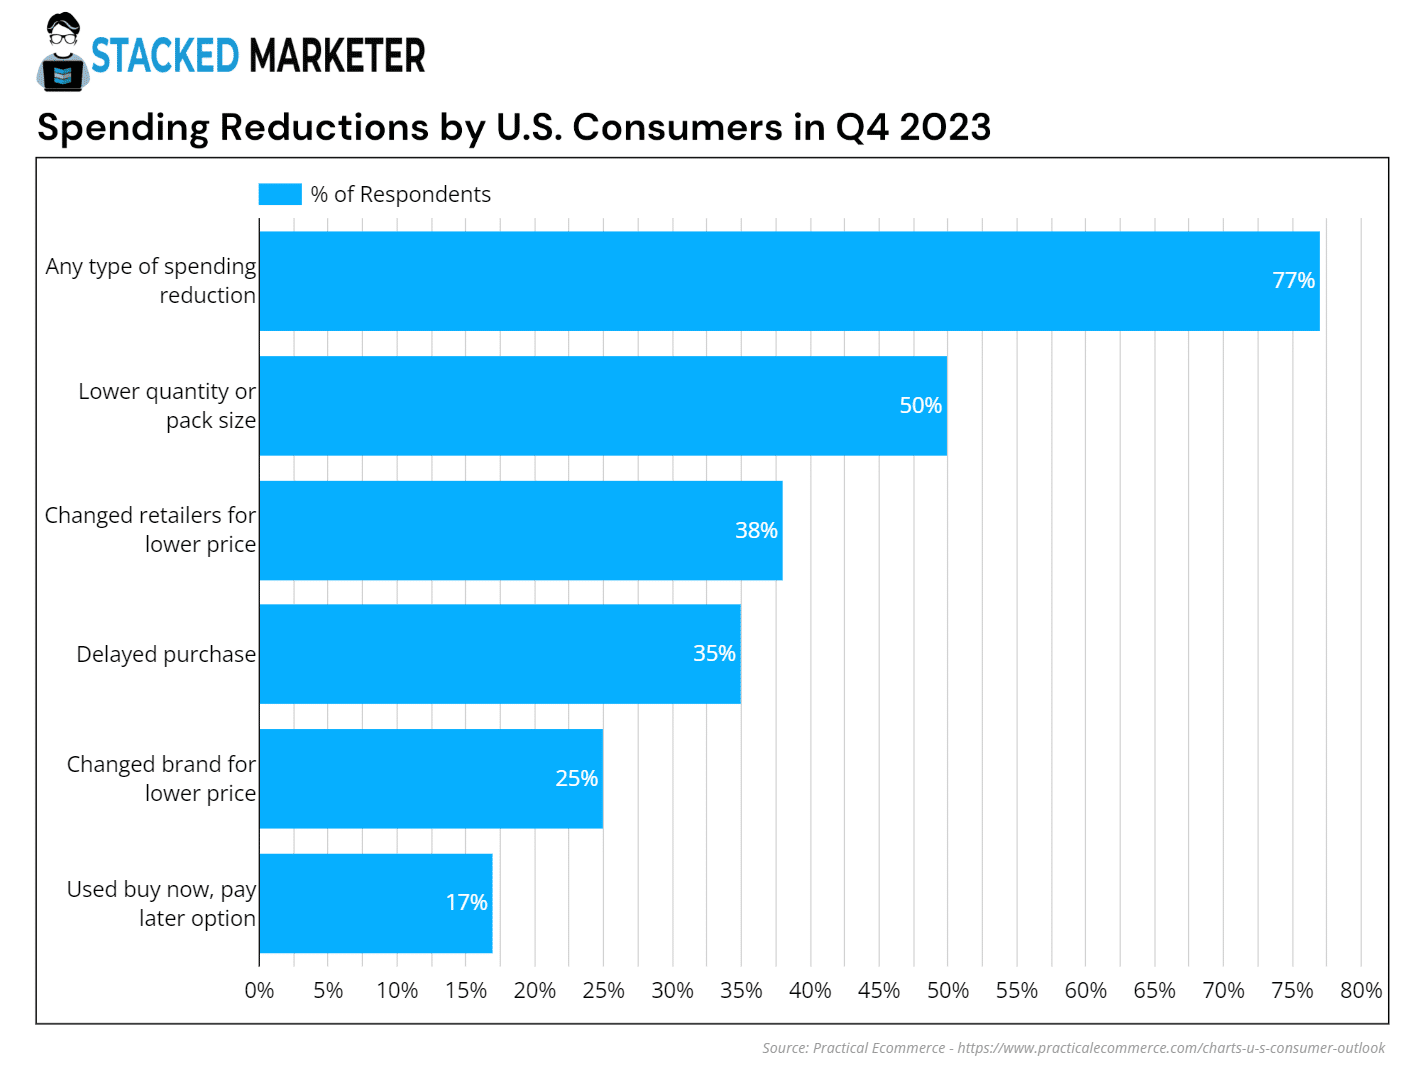
The same report tells us that most shoppers will still look to reduce spending in 2024.
What can you do: If you want to compete in this unpredictable market, you have to consider that there’s an air of frugality all around. So make sure that your offers and your messages resonate with that.
Offering discounted bundles or straight up lowering prices, downsizing packages, adding delayed purchase or BNPL options can all help you through this period.
📰 Further reading: Get more insights before you implement a split payment purchase option by reading the now, pay later (BNPL) industry Data Story for more online commerce insight.
The shopping cart rolls across a bumpy surface…
E-commerce appears to be navigating through uncertain terrain at the start of 2024.
While recent records hint at resilience, closer look suggests a potential slowdown or consolidation phase has already commenced.
The rise in online stores is impressive, yet with diminishing spending power and increased caution prevailing, new merchants may face fierce competition.
The best you can do? Stay agile and strategize around the economic uncertainties. Yep, easier said than done…
Sources
The report sourced data from the following: